
Step 7: Export and Visualization
Visualization
Visualization allows you to view the results of the experimented workflows at a glance.
Workflow 1: Train - Compress - Convert - Benchmark
Workflow 2: Train - Convert - Benchmark
The results for each module are as follows:
- Train Metric and Loss Function
- Comparison of Model size, FLOPs and number of parameters
- Latency Measurement
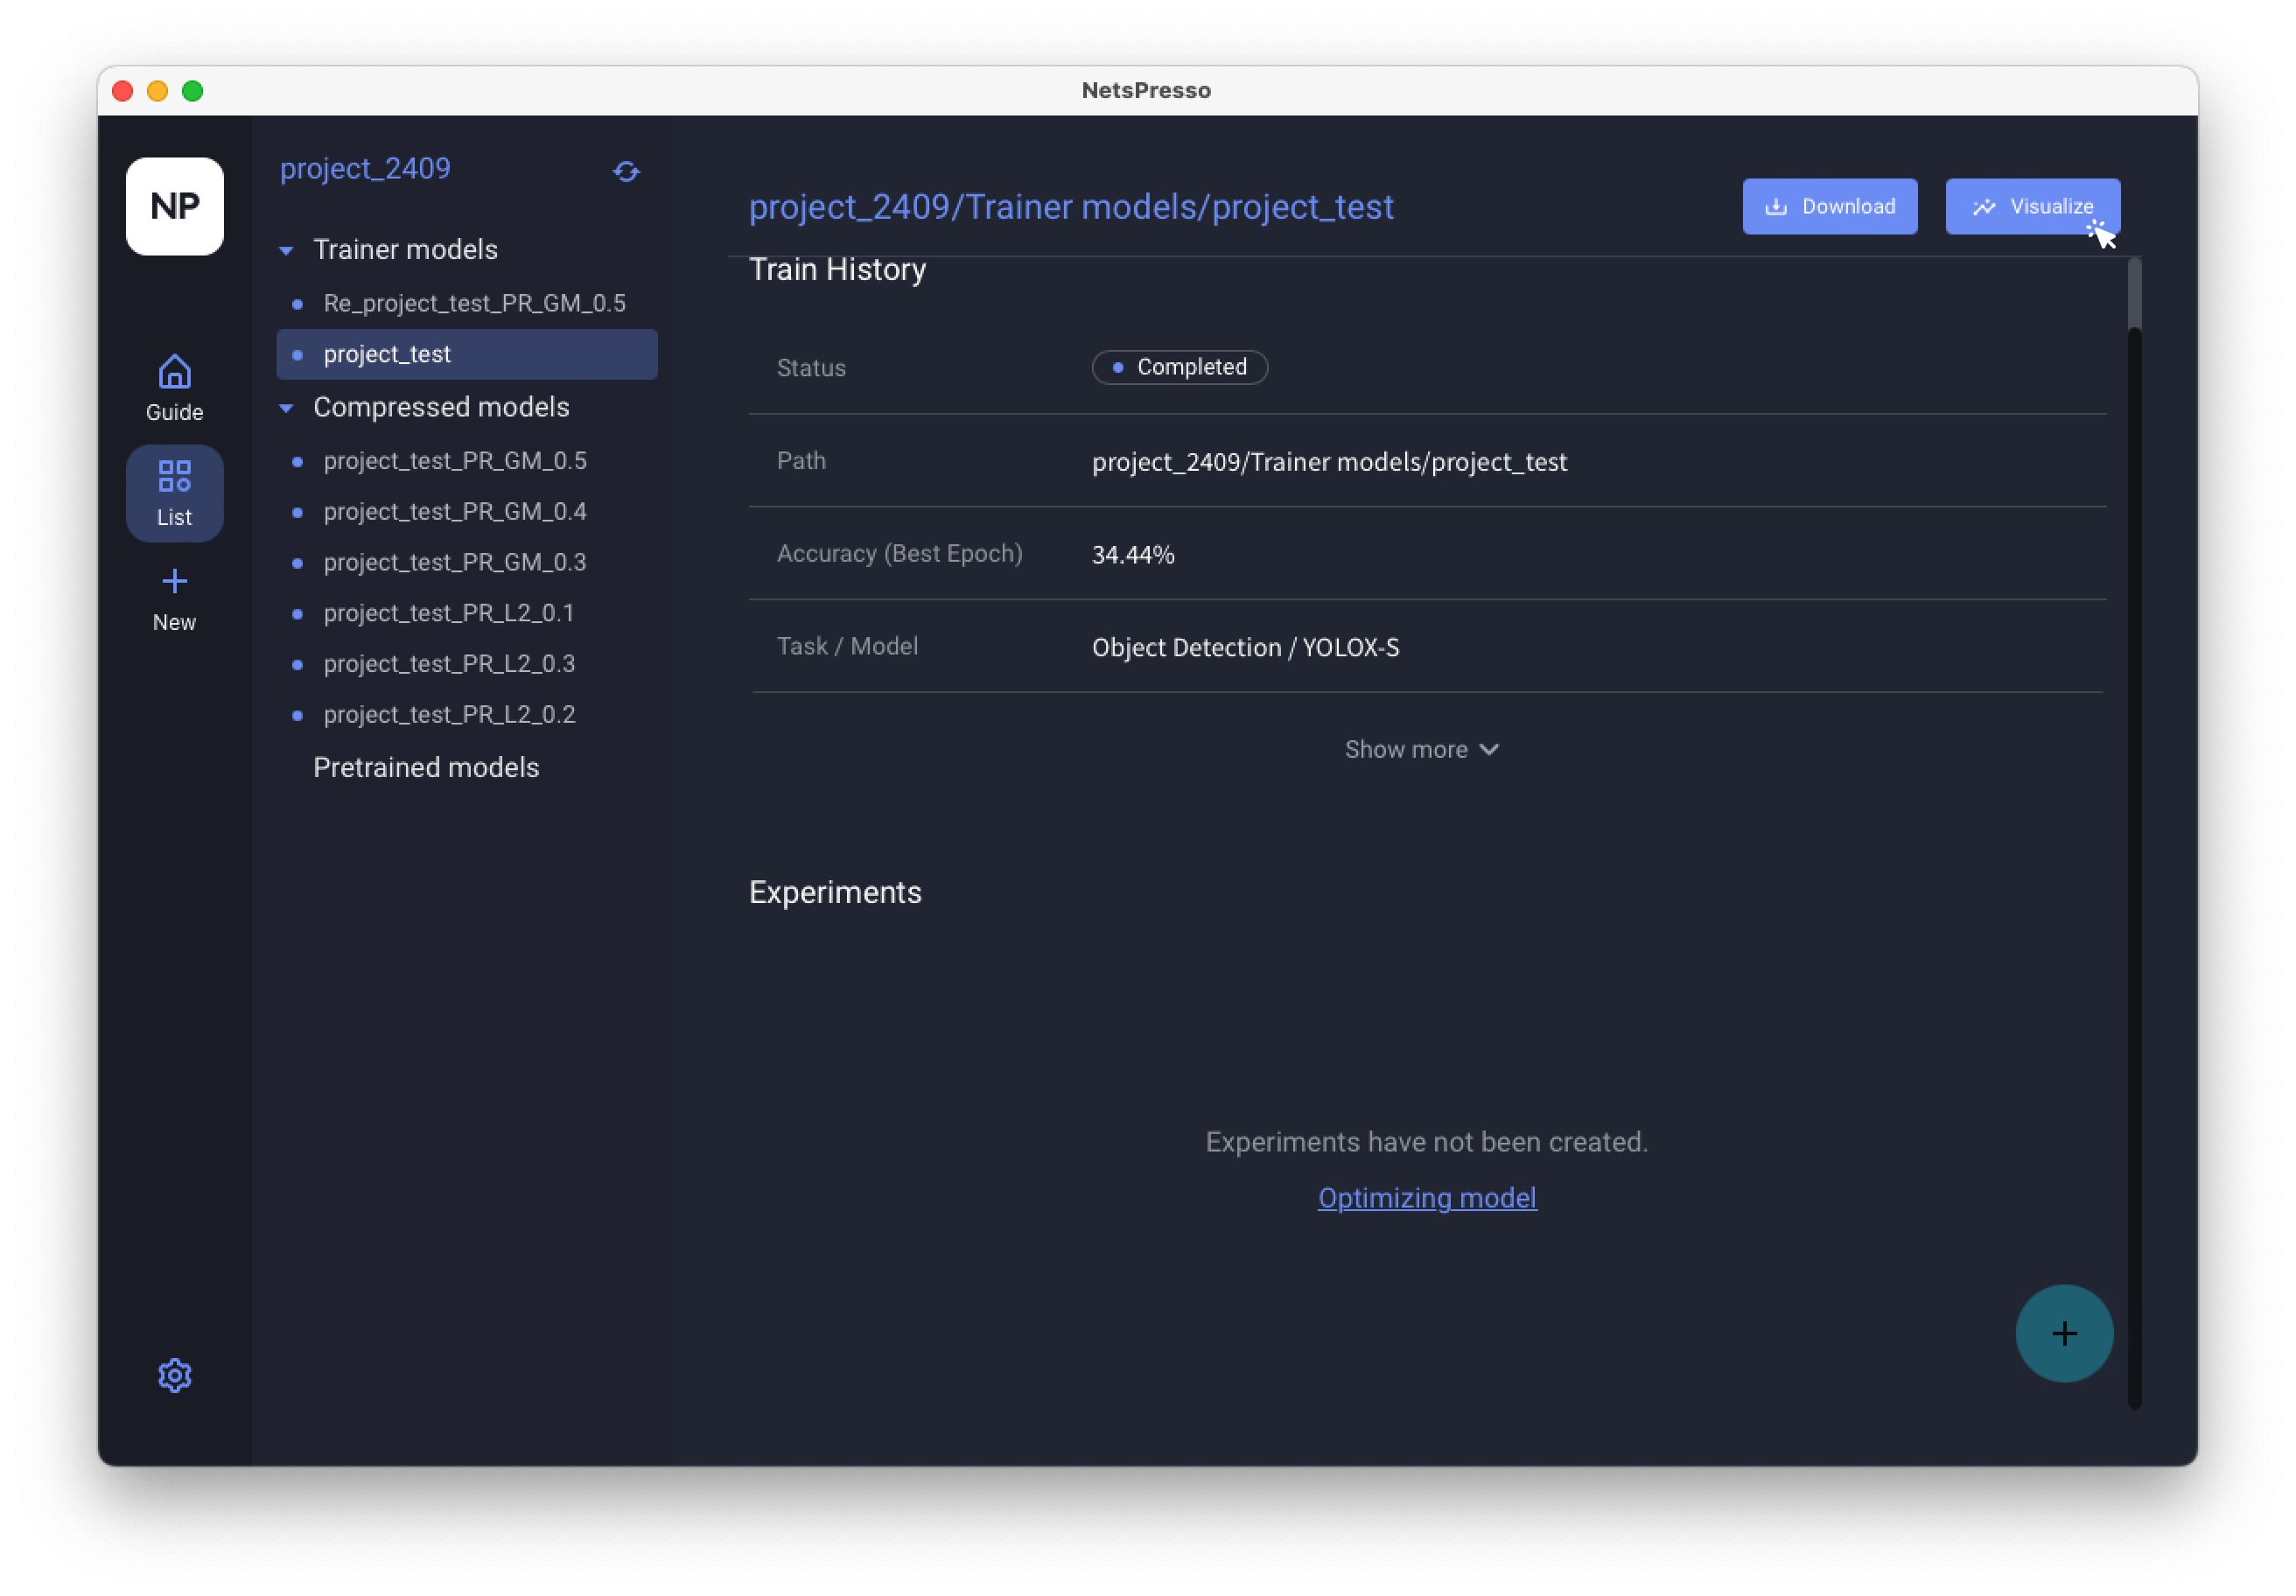
Click the 'Visualize' button located in the top right corner of the main screen. It will list the results for all modules with a status of completed.
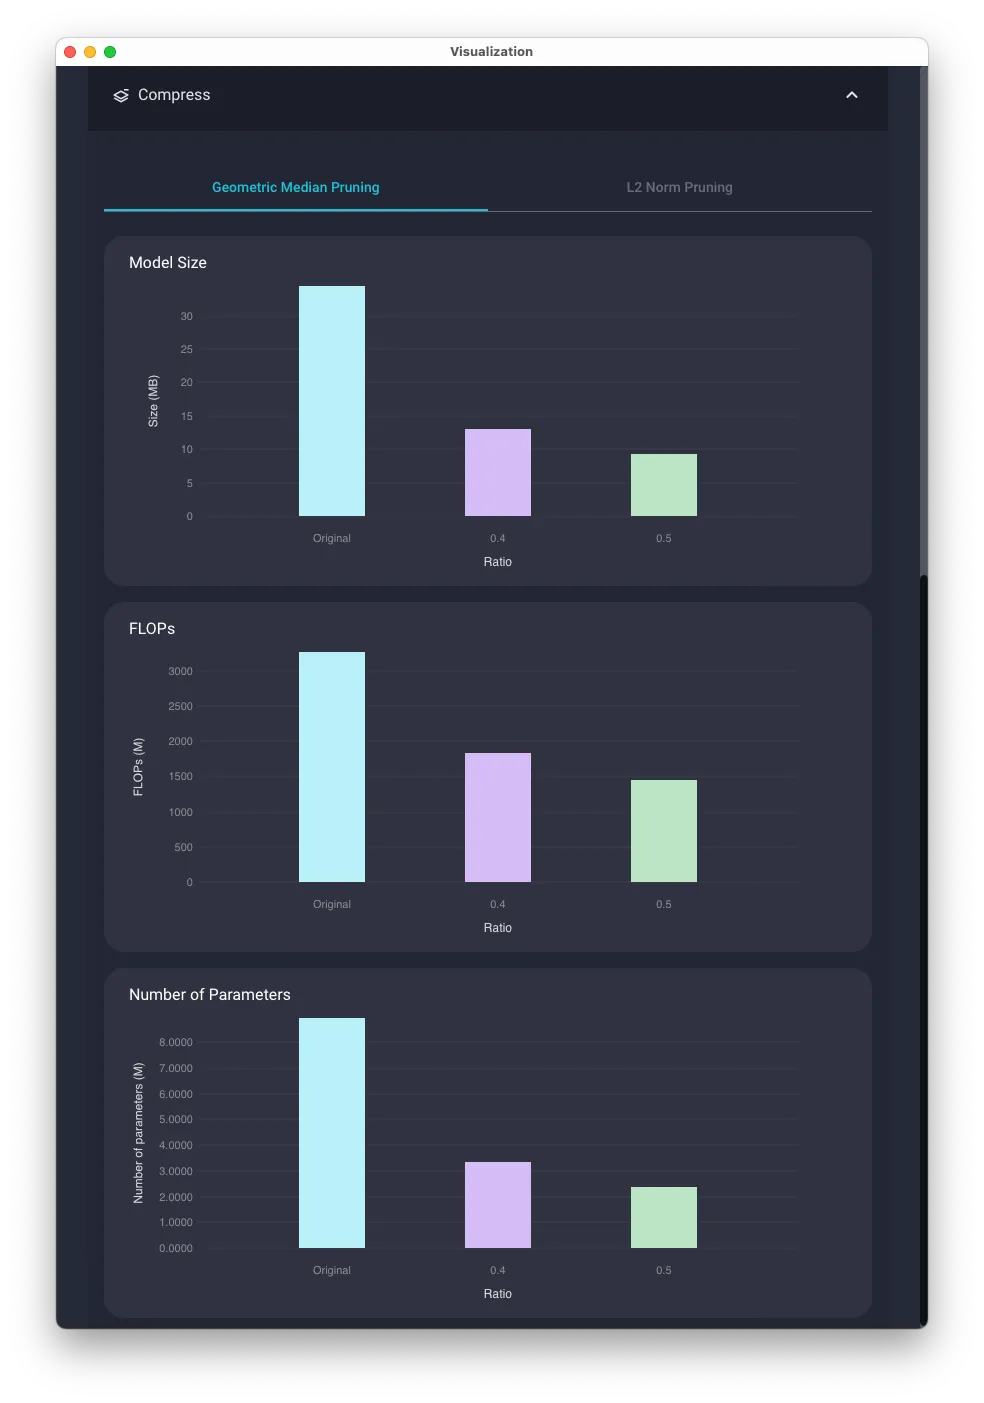
Example of Visualization
Export
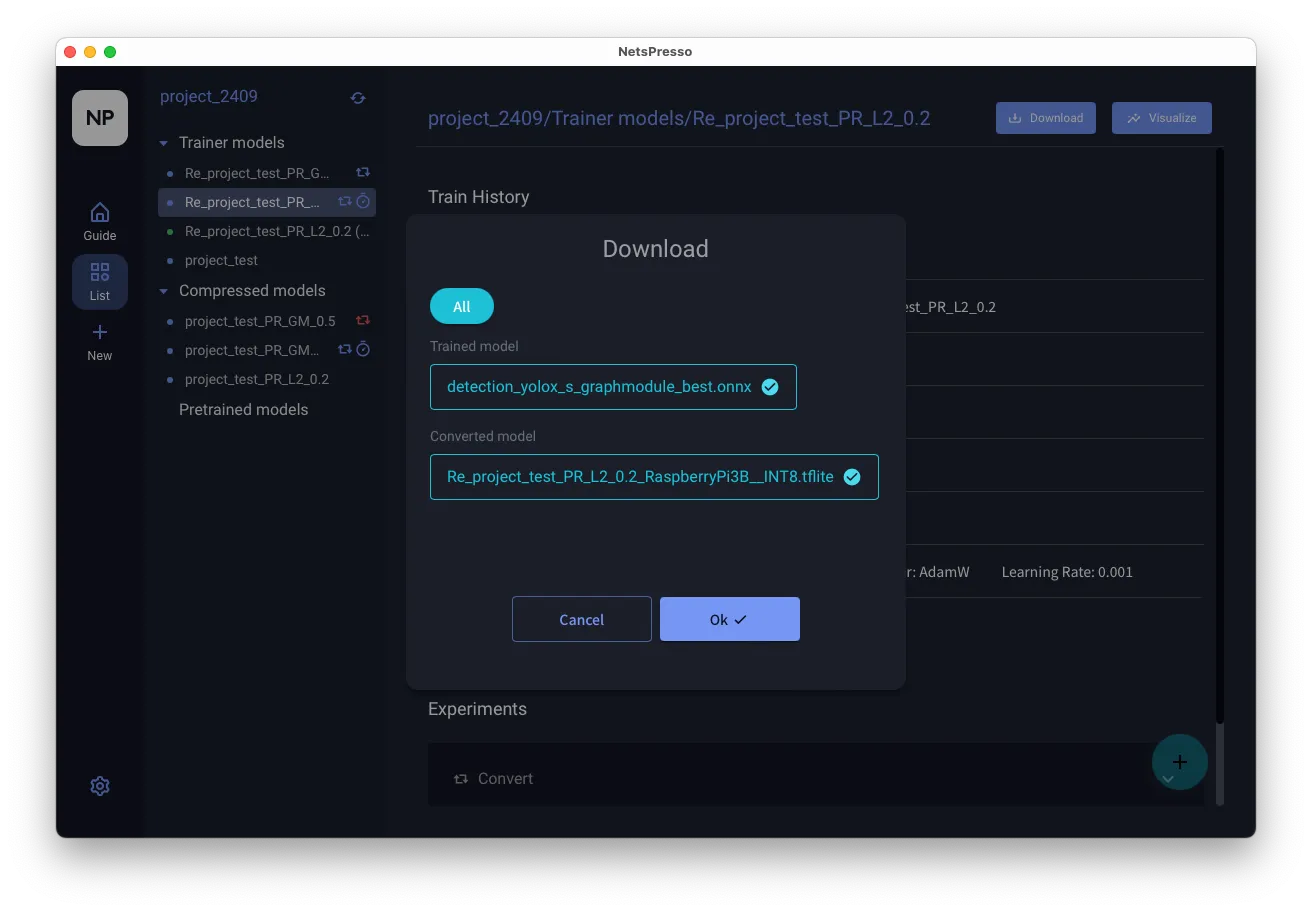
You can download the optimized workflow to your local computer. By clicking the Download button in the top right corner of the main page, you can download the results of the related optimization experiments all at once
Download folder path
- The files will be downloaded to the Downloads directory on your local computer.
Updated 12 months ago
What’s Next