
Step 4: Review optimization results
After optimization is complete, you can review how the model’s performance has improved compared to the original version. This screen presents a detailed, side-by-side comparison of the original and optimized models.
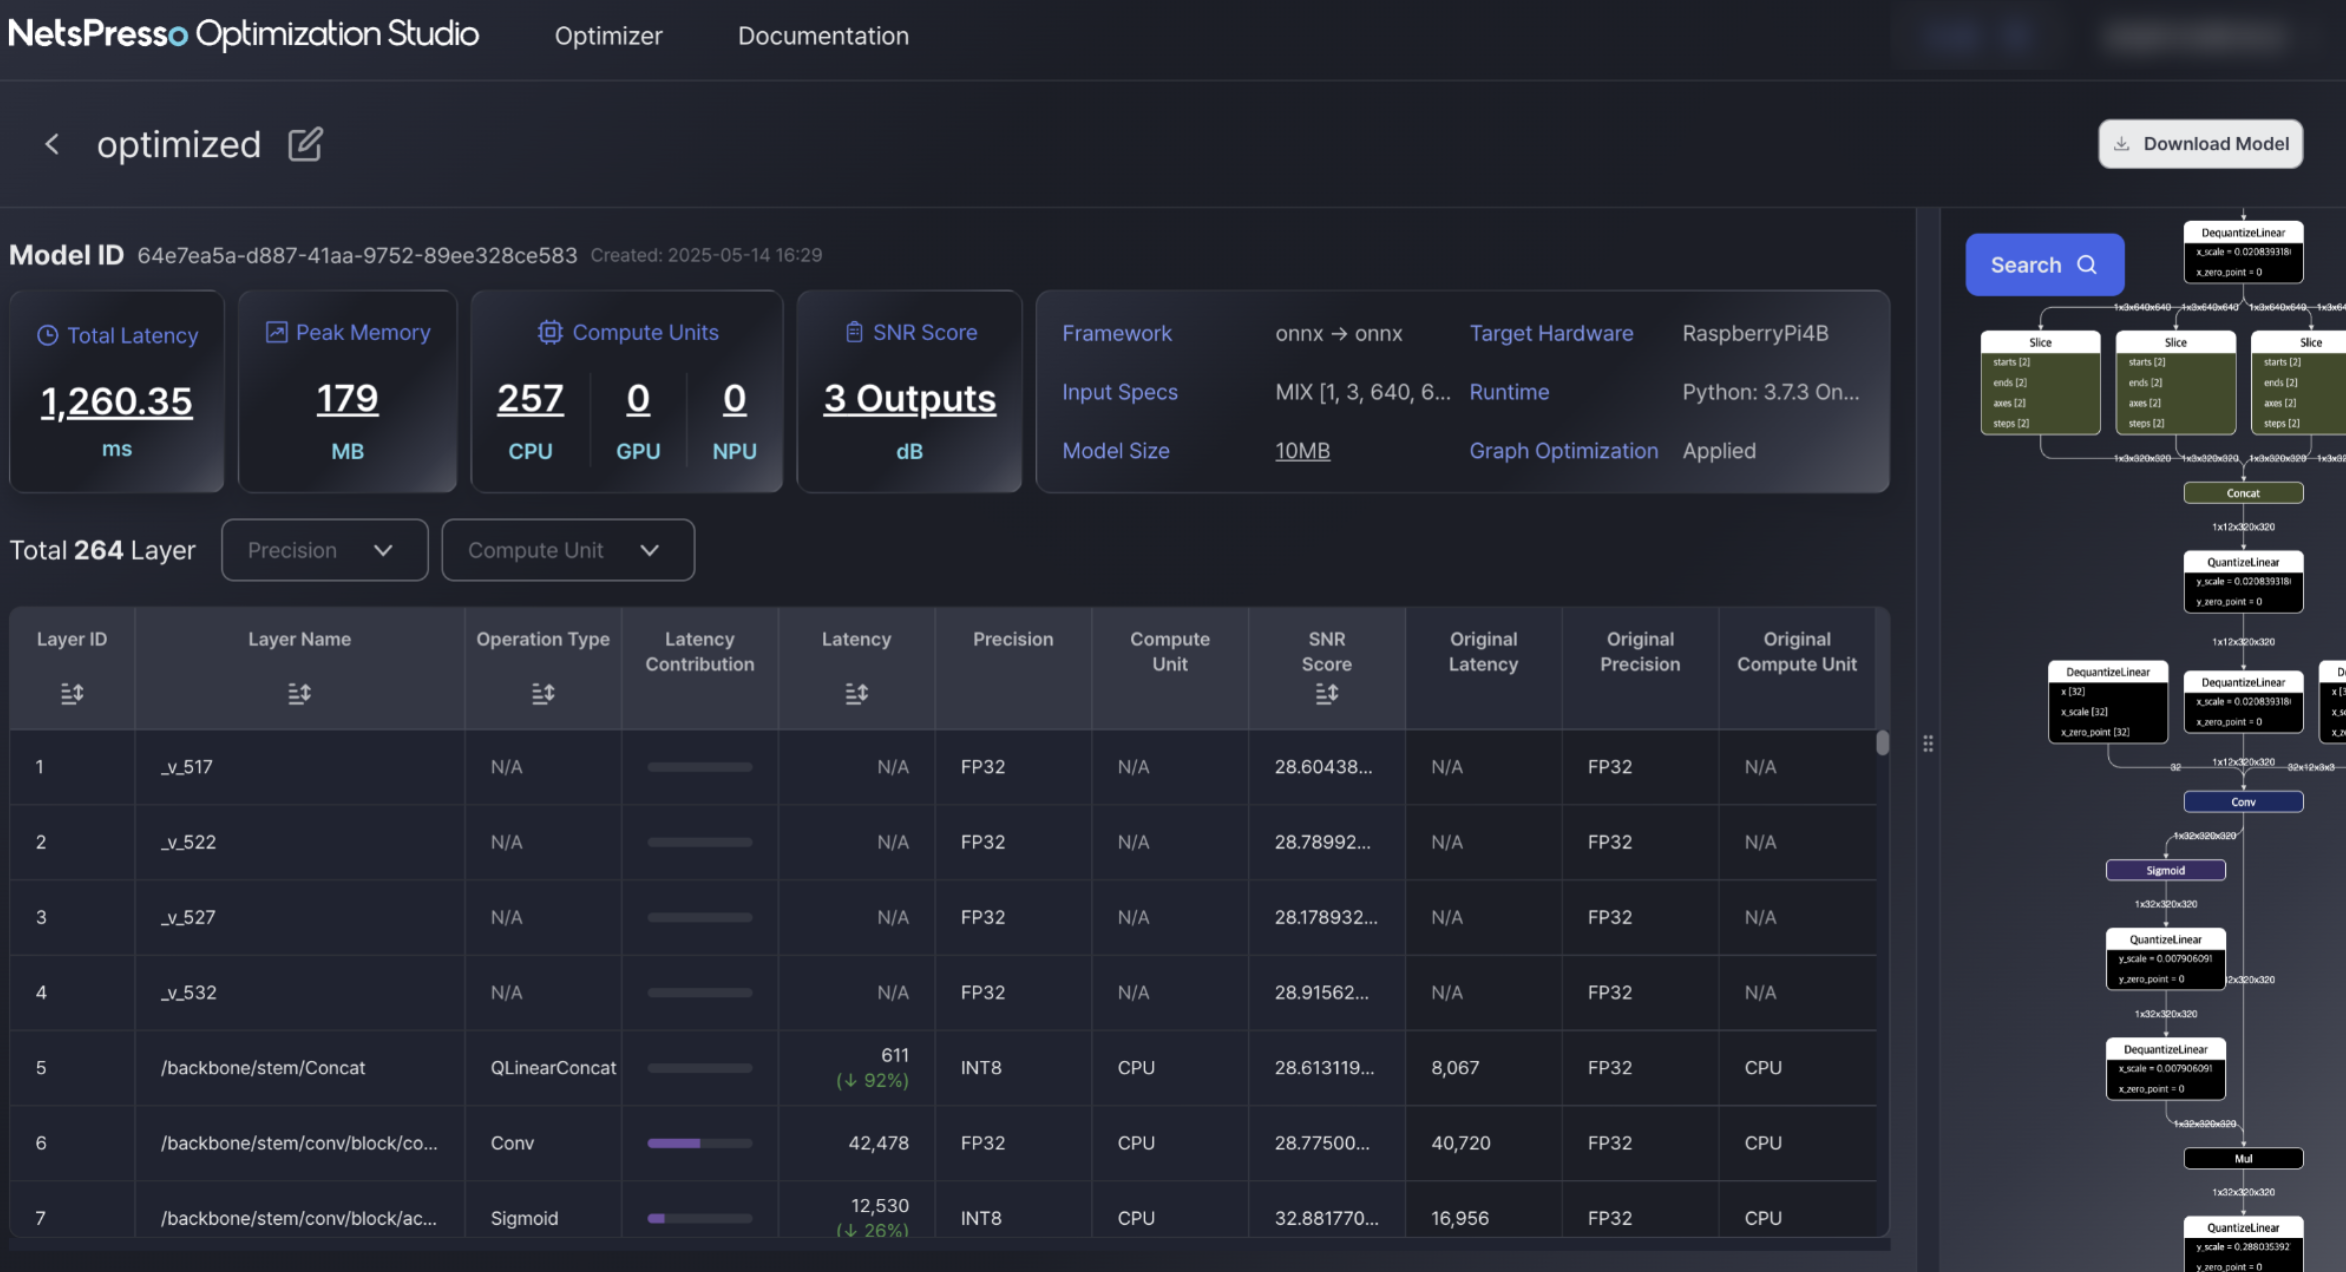
Key Performance Metrics
You can compare the following metrics before and after quantization:
-
Total Latency
End-to-end inference time with percentage improvement from the original model. -
Peak Memory
Maximum memory usage during inference, shown with memory reduction rate. -
Model Size
File size of the quantized model compared to the original. -
SNR Score
Signal-to-Noise Ratio that indicates how much numerical accuracy was preserved after quantization.
Layer-wise Comparison
Each layer in the model shows:
- Optimized Latency vs. Original Latency
- Target Precision vs. Original Precision
- SNR Score per layer
- Latency improvement %
Use this table to identify which layers were optimized and how much gain was achieved from each.
Visualized Model Graph
On the right side, the model graph reflects the updated computation structure, including quantization operators (e.g., QuantizeLinear, DequantizeLinear). This helps verify that the model has been structurally updated for deployment.
Use this view to confirm the integration of quantization operations and to trace the flow of precision changes across the network.
Download the optimized model
After reviewing the results, you can download the optimized model directly from the top-right corner of the screen.
Once downloaded, you will be able to:
- Run benchmark tests on supported target devices on Benchmark Studio.
- Compare performance with other model versions.
- Deploy the model to your target hardware or production environment.
- Use it as input for further post-processing or validation pipelines.
Updated 10 months ago