
Step 2: Review profiling results
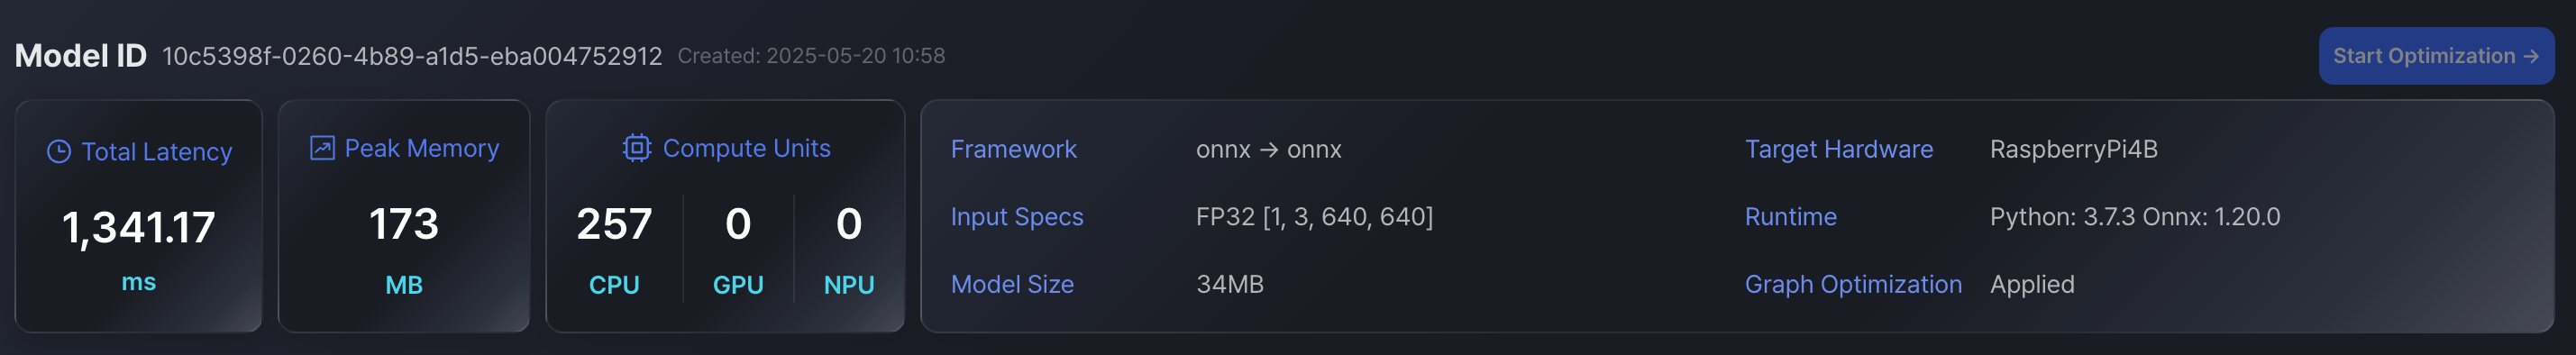
Once your AI model is uploaded, you can review its detailed structure and performance profile before starting optimization.
What you can check in this step:
-
Total Latency
The model’s end-to-end inference time measured in milliseconds. -
Peak Memory
Maximum memory consumption during inference. -
Compute Units
Resource usage across CPU, GPU, and NPU (if applicable). -
Framework / Runtime / Graph Optimization
Information about the model’s framework version, runtime environment, and whether graph optimization has been applied.
Layer-Level Analysis
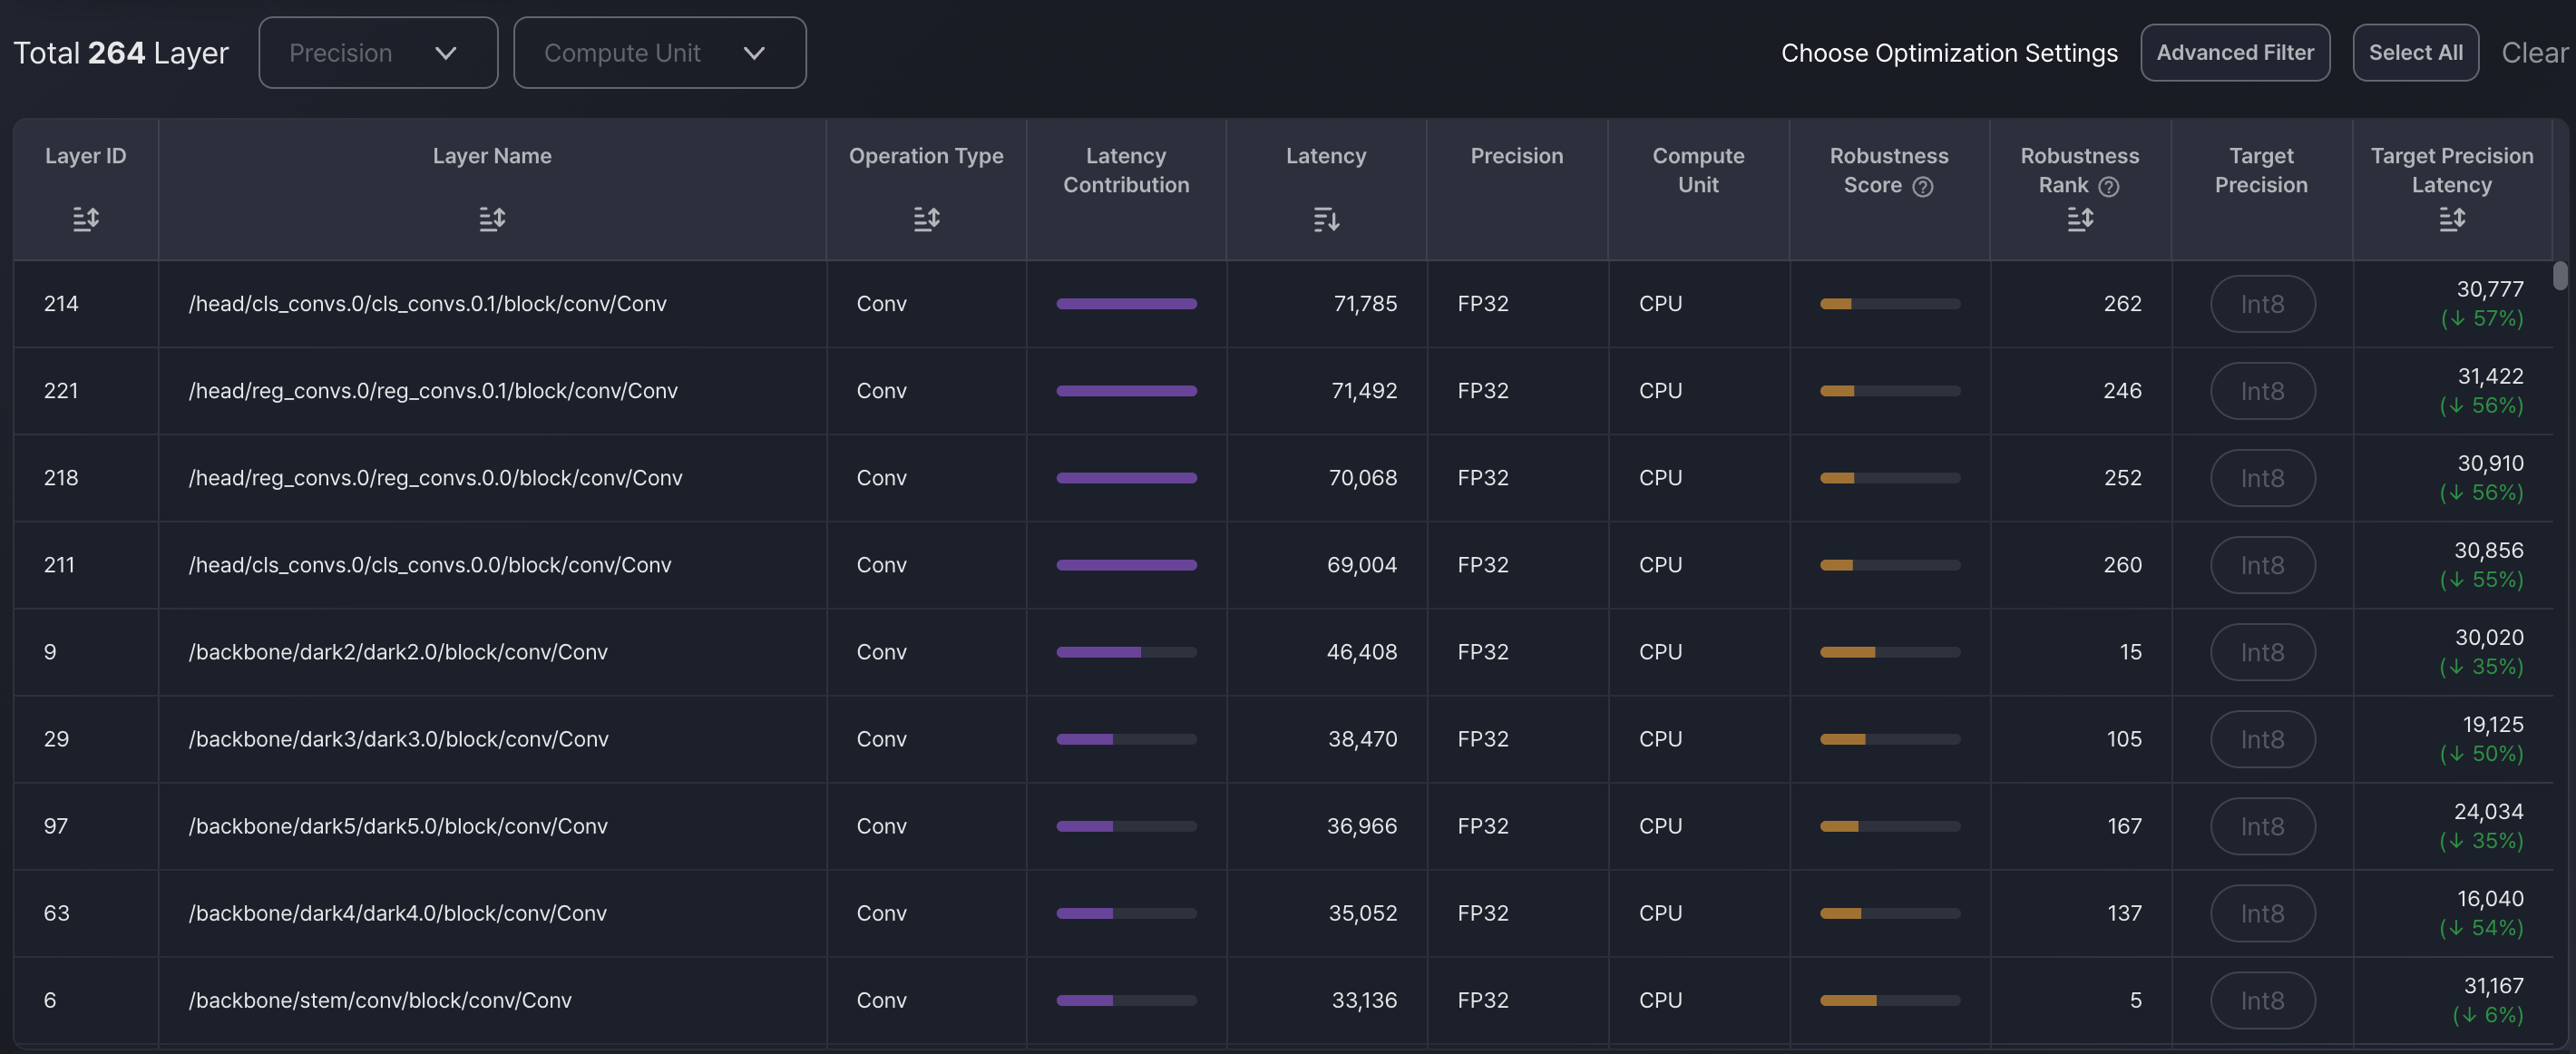
View all layers in the model along with:
- Layer name and operation type
- Latency contribution and compute unit
- Robustness Score:
Shows how safely a layer can be quantized without significantly affecting model accuracy. A higher score means the layer is more tolerant to precision reduction. - Robustness Rank:
Ranks all layers based on their robustness scores. A higher rank means the layer is more "quantization-friendly" and can be safely optimized earlier in the pipeline. - Sorting and filtering options for precision, latency, and sensitivity
This helps you understand which layers are performance bottlenecks or accuracy-critical.
Model Visualization
On the right side, a graph view of the model architecture allows you to:
- Visually trace the computation flow
- Inspect the data shape and operator structure
- Identify repeated or heavy operations intuitively
Updated 11 months ago
What’s Next